Textbook
Series
Ranking by Quality of
Instruction in Student and
Teacher Editions
Selected
Benchmarks
numcon.gif (492 bytes) numskil.gif (415 bytes) geocon.gif (549 bytes) geoskills.gif (479 bytes) algcon.gif (624 bytes) algeqcon.gif (699 bytes)
Connected Mathematics.
Dale Seymour Publications, 1998
partial most partial most most most
Mathematics in Context.
Encyclopedia Britannica Educational Corporation, 1998
most most partial most most most
MathScape.
Creative Publications, 1998
lgtblue.gif (107 bytes) most partial most minimal most
Middle Grades Math Thematics.
McDougal Littell, 1999
lgtblue.gif (107 bytes) most partial most partial most
Mathematics Plus.
Harcourt Brace & Company, 1994
blue.gif (107 bytes) most partial most minimal partial
Middle School Math.
ScottForesman-Addison Wesley, 1998
blue.gif (107 bytes) most partial most partial most
Math Advantage.
Harcourt Brace & Company, 1996
minimal most minimal partial partial minimal
Heath Passport
McDougal Littell, 1996
circle.gif (152 bytes) most most most partial partial
Heath Mathematics Connections.
D.C. Heath and Company, 1996
lgtblue.gif (107 bytes) most minimal most partial partial
Transition Mathematics.
ScottForesman, 1995
blue.gif (107 bytes) most partial most partial most
Mathematics: Applications and Connections.
Glencoe/McGraw-Hill, 1998
lgtblue.gif (107 bytes) most partial most minimal minimal
Middle Grades Math.
Prentice Hall, 1997
blue.gif (107 bytes) most partial most partial most
key.gif (4791 bytes)

most Most Content
partial Partial Content
minimal Minimal Content

**Note: For a high-quality print version, please use the Adobe PDF.

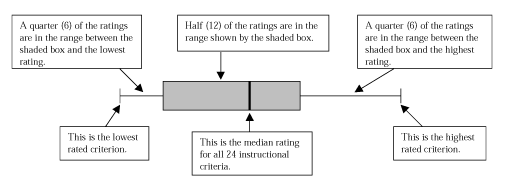
The chart compares 12 of the textbooks that were evaluated and shows how well each scored on its depth of coverage and the quality of its instructional support across all six benchmarks. The data represent both the range and variation of scores across the instructional criteria. The three top-rated textbook series had a median rating of more than 2.5 on a scale of 0-3 points for all of the 24 instructional criteria for all six benchmarks. To show the range of scores given to each book across the 24 criteria for instructional quality, the summary chart indicates the median and also the highest and lowest criterion scores for each textbook. The diagram below explains how to interpret the quality of instructional support data shown in the chart.
KEY

Return to Part I: The Ratings