![]()
|
The Resource Base for Education
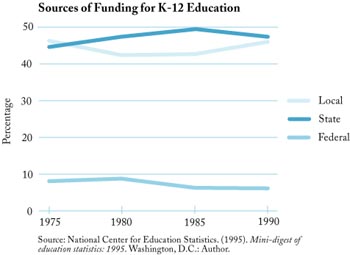
The United States raised more than $260 billion of revenue for its public elementary and secondary schools in 1993-94. Almost all of these resources were generated by taxes imposed by various levels of government, but state and local units of government contributed the largest shares (93%) with the federal government contributing the balance.1 This distribution of governmental responsibility for generating public education revenues has been changing. For many years, the share contributed by local governments declined in favor of increased shares for other levels of government. The federal percentage share peaked in 1980 and has been steady in recent years. In the 1990s, the state share began to decline, placing greater responsibility on local governments. The tax on real property is the primary means by which local governments raise tax revenues; rising tax burdens at the local level have sparked taxpayer protests that are frequently focused on the property tax.
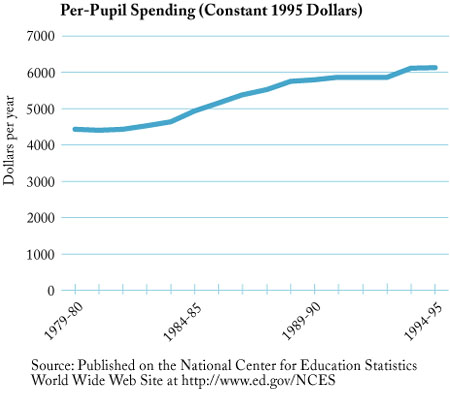
Changes have also been occurring in the absolute magnitude of the resource base for education in the United States. Evidence suggests that the level of investment has been increasing in real terms, although the precise magnitude of the increase is a matter of some dispute (cf. Rothstein, 1995; Odden, Monk, Nakib, & Picus, 1995). Odden estimates the increase at 200% in real terms per pupil over 30 years; according to Rothstein, estimates such as Odden's overstate the real growth by a factor of 40%. Much of the dispute over the precise magnitude centers around questions of changes in the needs of students and resulting changes in the nature of educational opportunities. If the public schools are delivering a significantly different product today than 20 years ago, it is clear that simple comparisons between what was spent then and now may be very misleading.
The basic conclusions that can be drawn are these:
The rise of taxpayer frustration with the burden they carry to support schools is also prompting exploration of nontraditional revenue sources. In particular, interest is growing in user fees; proceeds of fund raising; and grants from private groups such as businesses, foundations, and booster clubs. In most places these revenues are playing only marginal roles, but some public schools are beginning to raise significant sums of money in these unorthodox ways. This success suggests that resources are available and that an important challenge for reformers is to identify new mechanisms for citizens to support their public schools.
Spending on Public Education
There are a number of important questions to ask and answer about how the billions
of dollars that are raised for public schools are being spent. For example,
one might reasonably wonder about how much is spent on a typical pupil in the
public schools. The answer for 1993-94 was $5,325 according to the National
Center for Education Statistics (1996).
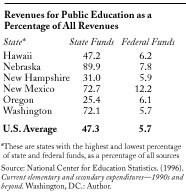
But, this answer can be misleading because it does not reveal the tremendous amount of variation that occurs across individually organized schooling units. Some of this variation exists at the state level. For example, the highest spending state in 1993-94 was Alaska at $9,075, and the lowest spending state was Utah at $3,206 (a difference of more than 2.8 to 1).
Significant variation can also exist within the individual states. For example, in New York during the 1993-94 school year, the district in the 90th percentile of the spending distribution spent close to twice as much as the district in the 10th percentile. Much larger spending discrepancies occur between districts at the extreme ends of the New York spending distribution curve.
The clear lesson to learn from these figures is that states, as well as individual schooling units, vary substantially in terms of the level of resources being invested in education. Some of the variation is due to factors such as differences in the cost of living, and some is due to fundamental, geographically based differences in fiscal capacity.
Spending by Function
Schooling systems provide a vast array of services, including some that are only tangentially related to education (e.g., food and transportation services). Overall, we now know that 60% of the education dollar (nationwide) is spent on instructional services. The 60% figure is remarkably consistent across school districts of different size, wealth, spending level, region, incidence of minority populations, and incidence of children living in poverty (Odden et al., 1995). Thus, it appears that while districts have significantly different levels of resources to spend, they apportion their resources in much the same way. It also appears that the 60% level has remained steady during the past 35 years.
The remaining 40% of the education dollar is divided across other budget
categories as shown in the table below.
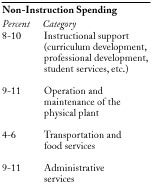
There has been a contentious debate in recent years over the level of spending on administrative services. Critics of the public schools have been known to talk about an "administrative blob" that is drawing resources away from the instructional core of the schools, particularly in large city schools. Research is showing little evidence of "blob-like" drains from the instructional budgets of the schools, even those located in the large cities (Odden et al., 1995). Indeed, some research is showing that, while never large, the percentage being spent on central administration has been dropping in recent years (Roellke, 1996).
Spending Earmarked for Science Education
Various estimates have been made about the level of investment in science education. For example, the Federal Coordinating Council for Science, Engineering, and Technology (FCCSET) (1993) estimated that the federal government spent at least $2.2 billion on education programs specifically targeting science, mathematics, engineering, and technology (SMET). Total federal spending on education, including programs not focused specifically on SMET education, was estimated to be $24 billion in 1993 (FCCSET, 1993).
Recent research has looked at the allocation of instructional resources across different areas of the secondary school curriculum. For example, in 1992-93, New York State school districts on average provided 4.23 secondary science teachers per 1,000 district pupils. This allocation represented 12.2% of the teaching resource provided at the secondary level. The allocation of resources to secondary mathematics was larger, amounting to 4.65 teachers per 1,000 district pupils or 13.4% of the total teaching resource. (Monk, Roellke, & Brent, 1996).
The New York research also included analyses of how school district characteristics such as incidence of poverty were related to the allocation of resources to science and mathematics. Remarkably, wealth and per-pupil spending levels are largely unrelated to the allocation of teacher resources to science and mathematics. Indeed, it is only among the wealthiest and highest spending districts in the state that there is any evidence at all of an increase in the numbers of teachers in these key disciplines. The research shows that science and mathematics are not unique in this regard; the number of teachers in all academic curriculum subjects is relatively unaffected by differences in districts' wealth and overall spending levels.
Significantly different resource allocation practices have been found between remedial, regular, and advanced courses in mathematics and science. Specifically, a greater degree of course differentiation of this kind was found in New York for mathematics compared to science. In mathematics, 70% of teacher assignments were categorized as regular; in science, the comparable figure was 91%. Moreover, the differentiation that occurred in science took the form of more advanced (rather than remedial) offerings. In science, the proportion of remedial courses was 1%, while the comparable figure for mathematics was 21%.
According to the New York data, allocations of teachers to science and
mathematics have been increasing.
Between the 1982-83 and 1991-92 school years, the teacher supply per pupil grew by 6.02% in science and 4.31% in mathematics.
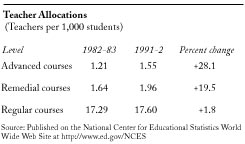
The longitudinal results regarding curricular differentiation are also of interest. Across all academic subjects there was growth in both advanced and remedial offerings that significantly outpaced growth in teachers allocated to the "regular" area of the curriculum. It is clear that most of the new staff going into the academic curriculum during this period of reform was directed away from the so-called regular offerings.
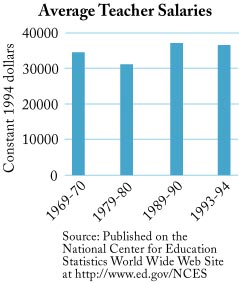
Spending on a Key Input: Teachers
Research has also been conducted on the level and nature of teacher compensation. There is a longstanding debate over what teachers should earn as they practice their craft. On the one hand, advocates of higher salaries argue that teaching is an undervalued profession. Proponents of this view typically cite as evidence the higher salaries that are received by accountants, architects, physicians, and lawyers. Evidence suggesting that teachers are poorly paid relative to certain civil servants is also often cited in this context. Those who question the wisdom of higher teacher salaries draw attention to the ten-month nature of most teaching contracts, the relatively small number of hours spent in direct contact with students, and the high degree of job security and guarantees of due process that frequently accompany employment as a public school teacher.
The effects of new reform dollars coming into the educational system
on teacher salaries are of special interest to science education reformers.
A common worry is that new dollars could simply lead to higher salaries
with little concomitant change in the nature of teachers' instructional
efforts. Taxpayers would then find themselves paying more for the same
product and thereby inadvertently contributing to a decline in the productivity
of the schools.
High-spending districts could be compared with lower-spending districts to see how much of the extra resources are devoted to teacher salaries. Recent research of this type (e.g., Barro, 1992, and Picus, 1993) suggests that only a very small percentage of the additional dollars being spent in high expenditure districts can be traced to teacher salaries per se. The dominant uses of the higher spending levels are for more teachers (i.e., smaller average class sizes), more services for students with special educational needs, and non-instructional services.
There is a renewed interest in designing teacher compensation systems that establish stronger ties between compensation and performance. The history of these efforts (see Murnane & Cohen, 1986) is not encouraging. However, some new ideas have been advanced in recent years that involve reliance on group rewards and "gain-share" strategies (Odden, 1994) that use compensation to stimulate performance. As Murnane and Cohen (1986) observed, the idea that compensation is tied to performance can foster a willingness among taxpayers to invest in education. Progress on the reform of teacher compensation practice needs to be a high priority for any reform-minded group in education.
Research on how resources are spent on teachers consistently finds that typically less than 1% of the budget is earmarked explicitly for teachers' continuing professional development (Darling-Hammond, 1994; National Commission on Teaching and America's Future, 1996). There seems to be a growing awareness that teachers need strengthened professional development programs, and there may well be greater willingness to spend new dollars on professional development rather than upgraded salaries and benefits for teachers.
The Dollars Do/Don't Matter Debate
Before real progress can be made toward understanding the implications of differences in spending levels on education, insight is needed into the productivity of the existing educational system. Many critics find serious productivity problems (e.g., Hanushek with others, 1994). The underlying research literature on the topic is vast and largely inconclusive, with researchers sometimes drawing conflicting conclusions from the same studies (cf. Hanushek, 1989, and Hedges, Laine, & Greenwald, 1994). The chief lessons to learn are these:
It is useful for policy makers to have cost estimates of proposed reforms before they make decisions about implementing them. This is particularly true for the ongoing efforts to implement site-based decision-making, redesign curricula, raise academic standards, reform pupil assessment practices, and further "professionalize" the field of teaching.
Certainly, it would be desirable to have estimates of the costs associated with implementing science education reform. However, there are at least three reasons why it is difficult to obtain even first approximations of the real costs associated with such reform, and these need to be understood by those who are seeking to implement the reform.
First, significant reforms entail significant departures from current practice. It is relatively easy to estimate costs of current practice because there is a track record that can be studied. But where policymakers are debating whether to pursue a significantly new set of practices, the track record is less available. Sometimes pilot efforts can be considered, but cost analysts still rely heavily on assumptions about what would happen if the pilot were fully operational.
Second, there is the "supplement versus supplant" problem. The very reason that a reform is being contemplated suggests problems with existing practice. To the extent that reform measures can substitute for existing practice, some savings need to be factored into estimates of the marginal cost of reform. It follows that the cost of a reform should not be viewed as a simple add-on to existing practice. However, it is also the case that the analyst is not entitled to simply subtract the cost of all practices deemed deficient. The implementation of reform is often difficult and the reluctance to change fundamental practice needs to be taken into account in estimating costs.
Third, suppose enhanced scientific literacy significantly improves the quality of public discourse over land use, the disposal of nuclear waste, and a host of other technologically connected issues. Society could find itself avoiding the costs of future mistakes, and these savings are relevant to a full cost/benefit accounting of science education reform. Of course, it is difficult to do much more than recognize that these savings/benefits could be significant.
Although these difficulties are daunting, it is nevertheless important for policy makers to have a grasp of the resources that reform will require. There have been some cost estimates for efforts similar to this reform, but current science education reform is unique in terms of the breadth of its goals.
This being said, there are some estimates that can begin to inform the debate. For example, at least $117 million were spent between 1954 and 1975 on National Science Foundation reforms (Jackson, 1983). And Elmore (1993) reports that the Physical Sciences Study Committee spent between $1 and $1.5 million from 1956 to 1961 in direct development costs and probably three times that amount in indirect costs. He also notes that the Biological Sciences Curriculum Study has spent in the neighborhood of $10 million in direct expenditures and several times that amount in indirect expenditures.
Other efforts to estimate these costs include the work of Borg and Gall (1989), who argue that the cost of developing a single minicourse that provides 15 hours of instruction was more than $100,000 in the early 1970s. They estimate that a similar major curriculum project today costs several million dollars. They also note that the ratio of 1:10:100 is used in industry to estimate funding requirements for research and development: if $1 million are required to do the basic research for a new curriculum product, it would require $10 million more to develop the product through the operational field test and revision phase, and 10 times that amount ($100 million more) to manufacture and disseminate the product.
Efforts have also been made to estimate the costs of continuing teacher professional development, another central element of science education reform. Miller, Lord, and Dorney (1994) estimated that between 1.8 and 2.8% of the operating budgets in the districts they studied was devoted to professional development, amounting to $1,755 to $3,529, per regular classroom teacher. It has long been noted that it is unusual for school districts to devote more than 1% of their budget allocations to professional development (Darling-Hammond, 1994). If states invested 1% of the $117 billion that they raised for public K-12 education in 1993-1994, the effort would require $1.2 billion dollars.
In addition to generating estimates of resource requirements for anticipated reforms, cost analysis can provide insight into the barriers that make implementing reform difficult, i.e., costly. Economists are interested in the role incentives play in explaining the behavior of the various parties within educational systems. A cost can be thought of as a disincentive or impediment that needs to be overcome; sometimes those costs take subtle forms. For example, consider the case of a staff development program that periodically requires teachers to leave their classrooms in the hands of a substitute teacher. At first glance, the cost of this program would include the cost of funding the substitute teachers to free the classroom teacher for participation. However, teachers may still be reluctant to leave their classrooms on the grounds that their departure is disruptive, has adverse effects on the performance of their students, and requires more work for the teachers on their return. In such a case, the true cost of the program has been underestimated, perhaps to a significant degree. The failure to identify and offset these subtle costs may go a long way toward explaining why reform has been so difficult to implement. There is perhaps no surer way to compromise the effectiveness of a reform than to underfund it.
Recommendations
The following are recommended as broad strategies:
References and Bibliography
Chapter 4
Research
1These
data all come from the National
Center for Education Statistics (1996).
2See the
collection of papers edited by Robert
Berne and Lawrence Picus (1994).
Blueprints Online
Project 2061
American Association for
the Advancement of Science
Washington, DC
1997
Copyright © 1998 by American Association for the Advancement of Science